Technical Analysis
What is Technical Analysis?
Technical analysis is the examination of historical price movement in order to detect patterns and identify potential future market movements. This can be achieved through the use of indicators and technical studies, as well as other forms of analytical tools.
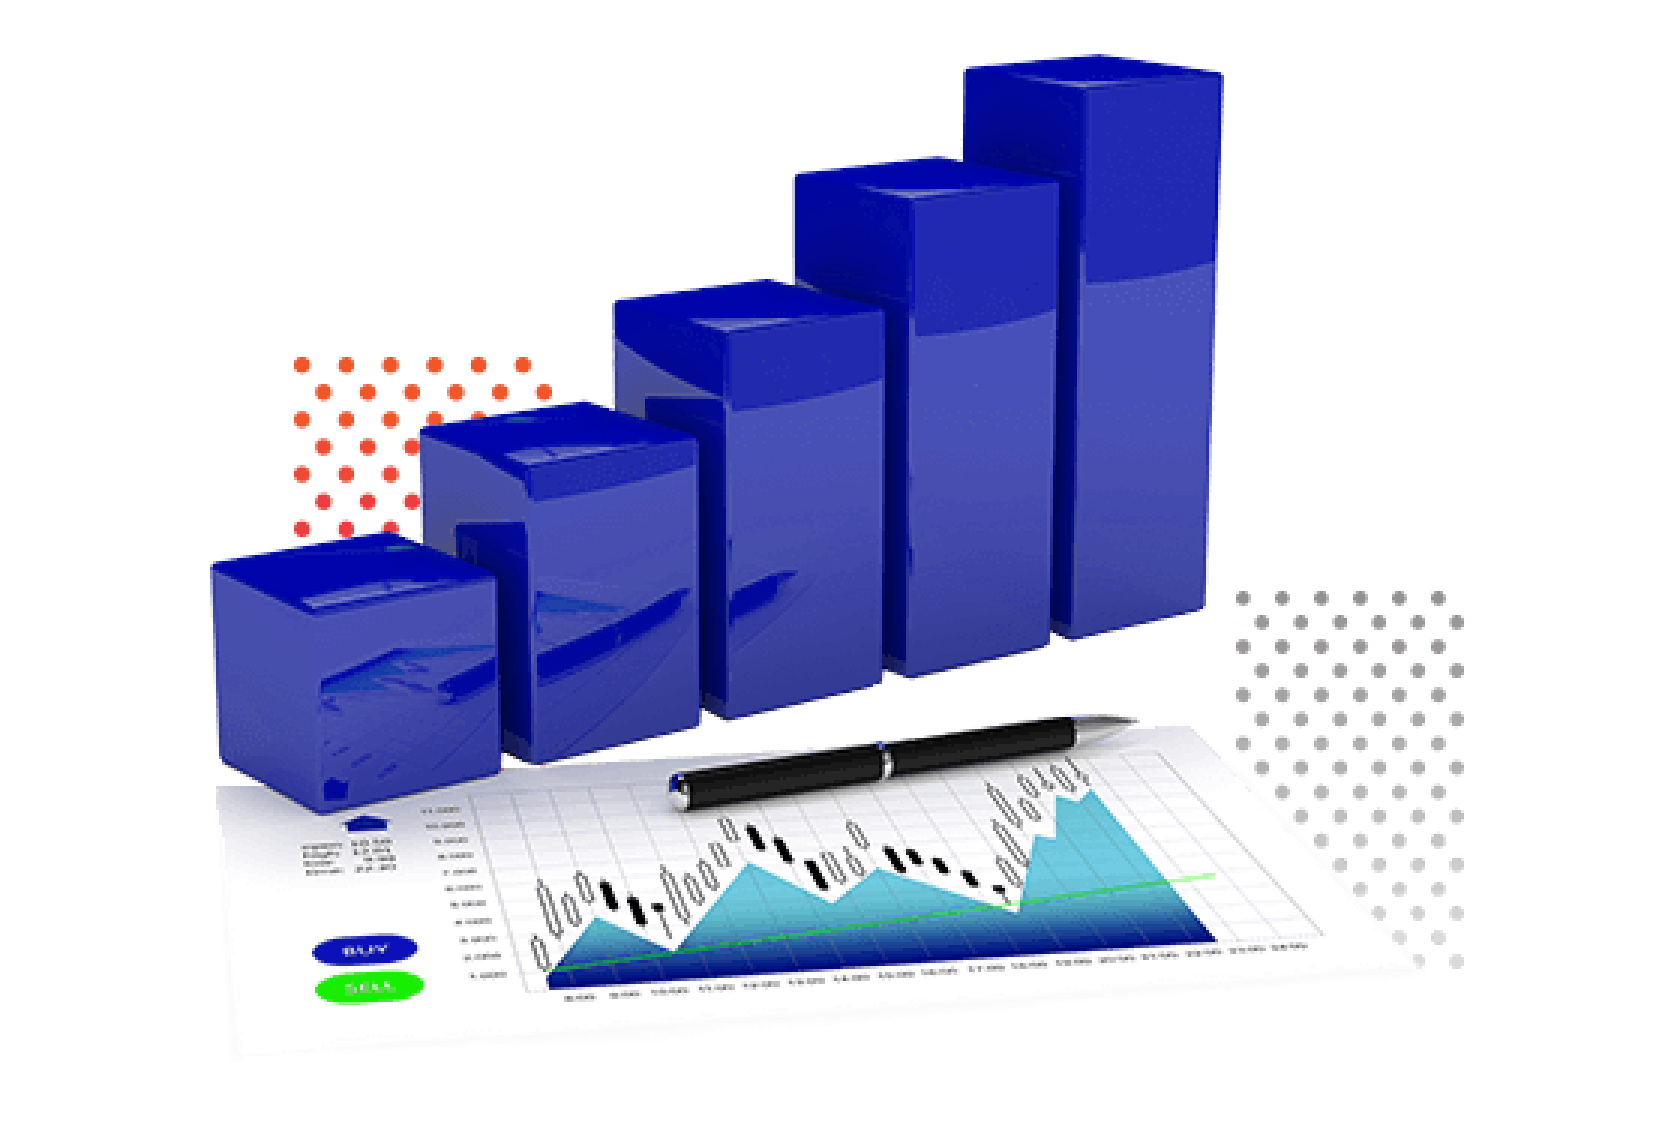
Technical analysis focuses on the price and volume of trades, with tools being used to scrutinise the historical trading data of any security, including stocks, futures, commodities, currencies, and many other securities. It can be used for both short-term, medium-term, and long-term trading.

Technical analysis is the examination of historical price movement in order to detect patterns and identify potential future market movements. This can be achieved through the use of indicators and technical studies, as well as other forms of analytical tools.
Technical analysis focuses on the price and volume of trades, with tools being used to scrutinise the historical trading data of any security, including stocks, futures, commodities, currencies, and many other securities. It can be used for both short-term, medium-term, and long-term trading.
In modern times, there has been a rapid evolution of technical analysis. Due to many years of dedicated research and technical advancements, there are now hundreds of patterns and signals that have been developed.
The Origins of Technical Analysis
It is possible to chart the origins of technical analysis back to the 19th century and the Dow Theory, introduced by Charles Dow. This financial theory was an early technical framework and one of the oldest theories in relation to the stock markets and has six main components:

The market discounts everything

Primary trends have three phrases

Volume must confirm the trend

There are three primary market trends

Indices need to confirm each other

Follow the trend until a reversal occurs
Types of Technical Analysis
Over the course of time and within the trading industry, technical analysis has come to be supported by many hundreds of patterns and signals, developed and designed by market researchers. The significant number of technical analysis tools now in existence means that there are many aspects of the market that are specifically focused on. This means that traders can narrow their focus to indicators that produce information that is of particular interest or importance to them. Some of the most commonly used technical indicators and charting patterns include trendlines, moving averages, momentum indicators, and channels.
Some of the main indicators that technical analysts look at are:
– Price trends
– Volume indicators
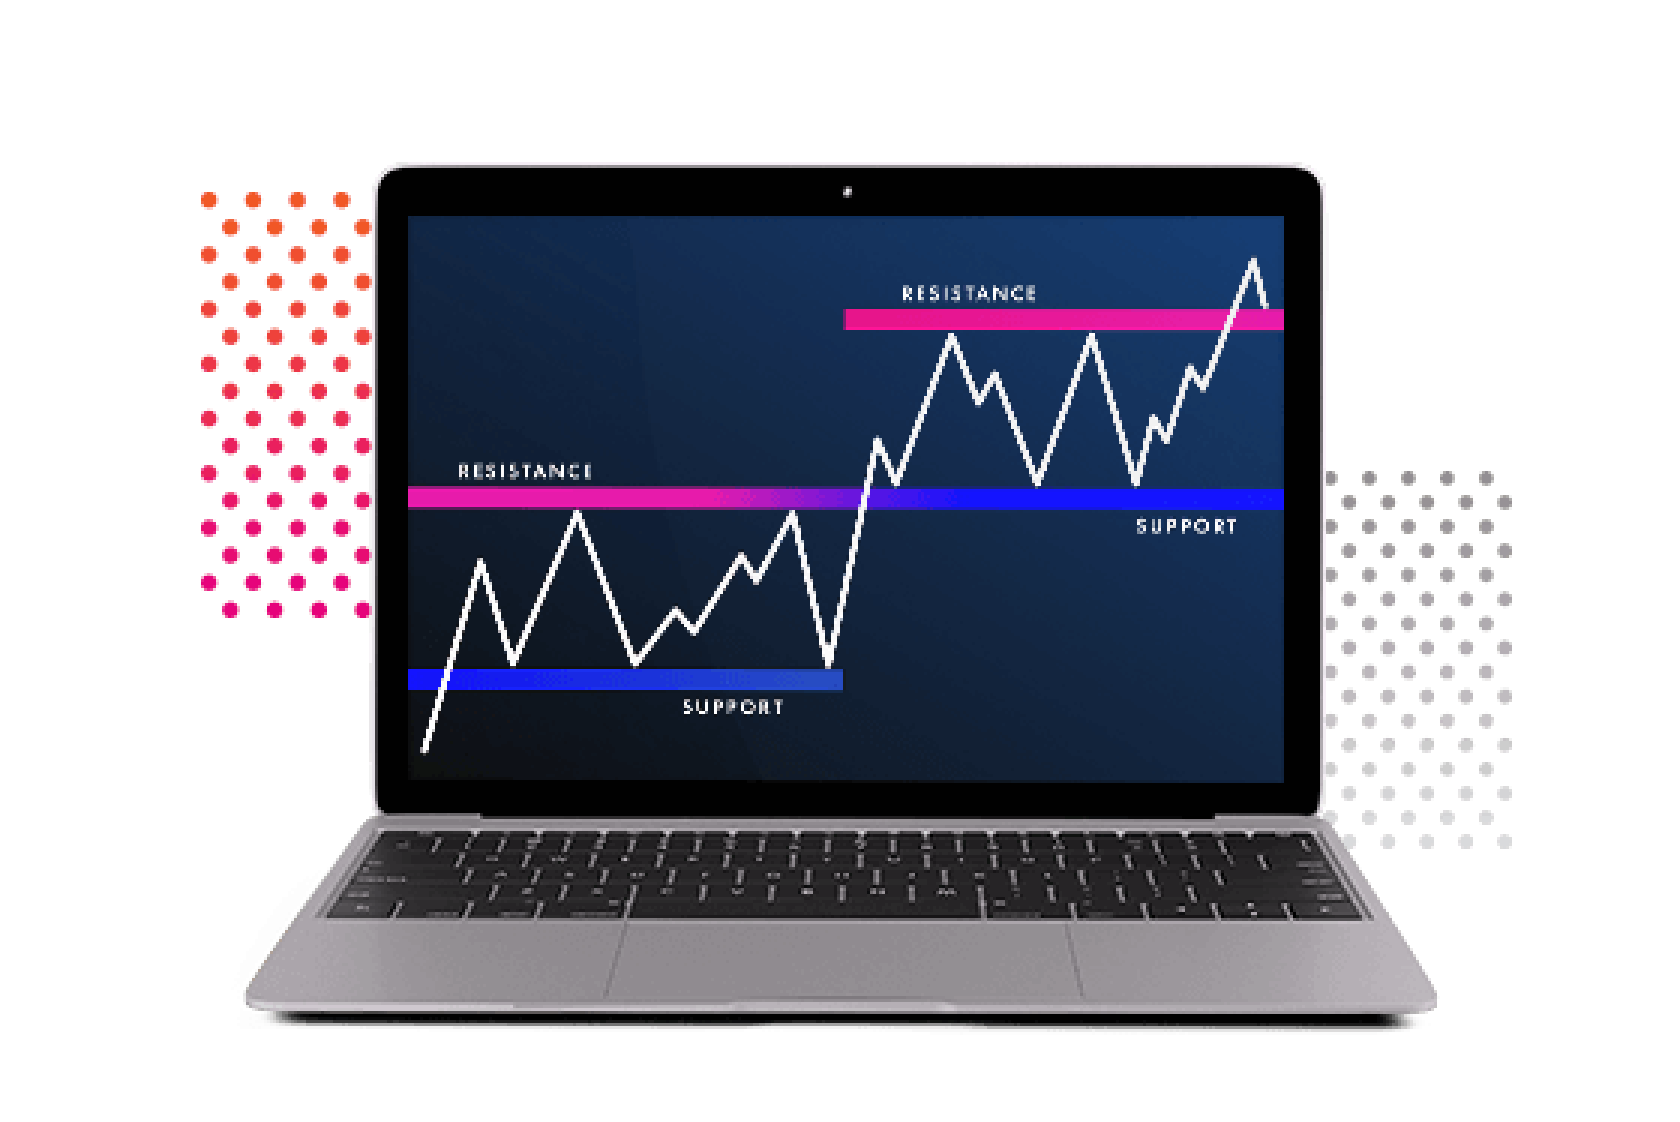
– Support and resistance levels
Some of the main indicators that technical analysts look at are:
– Price trends
– Volume indicators
– Support and resistance levels
In terms of charting analysis, some of the most common charts are:
– Bar charts
– Candle charts
– Chart patterns
– Levels (S/R)
– Gaps
– Oscillators
– Envelops/bands
In terms of charting analysis, some of the most common charts are:
– Bar charts
– Candle charts
– Chart patterns
– Levels (S/R)
– Gaps
– Oscillators
– Envelops/bands
The Origins of Technical Analysis
It is possible to chart the origins of technical analysis back to the 19th century and the Dow Theory, introduced by Charles Dow. This financial theory was an early technical framework and one of the oldest theories in relation to the stock markets and has six main components:
The market discounts everything
Primary trends have three phrases
Volume must confirm the trend
In modern times, there has been a rapid evolution of technical analysis. Due to many years of dedicated research and technical advancements, there are now hundreds of patterns and signals that have been developed.
Pros

Clear
Technical analysis’ charts produce a clear picture of market action through focusing on price movement. The information is then usually presented in a way that is easy to understand and quick to figure out.
Technical analysis uses primarily objective data, such as price and volume data, which is an important and valuable feature for those who choose to rely on it.
Patterns
The charts help to ensure that patterns are easy to identify, acting as a useful guide for technical analysts to make buy and sell decisions.
Cost
With the wide range of technical analysis out there, much of it is free or very inexpensive, especially since the development of computer systems in recent decades.
Cons

Volume
There is such a large number of indicators out there, and so if a technical analyst was to add too many of them to their chart, it could result in underlying price action being missed and too many differing signals, resulting in a paralysis of analysis.
Fundamentals
The underlying fundamentals of a company are not considered when it comes to technical analysis. This may present a risk in terms of dealing with longer timeframes.
Pros
Clear
Technical analysis’ charts produce a clear picture of market action through focusing on price movement. The information is then usually presented in a way that is easy to understand and quick to figure out.
Objective
Technical analysis uses primarily objective data, such as price and volume data, which is an important and valuable feature for those who choose to rely on it.
Patterns
The charts help to ensure that patterns are easy to identify, acting as a useful guide for technical analysts to make buy and sell decisions.
Cost
With the wide range of technical analysis out there, much of it is free or very inexpensive, especially since the development of computer systems in recent decades.
Cons
Volume
There is such a large number of indicators out there, and so if a technical analyst was to add too many of them to their chart, it could result in underlying price action being missed and too many differing signals, resulting in a paralysis of analysis.
Fundamentals
The underlying fundamentals of a company are not considered when it comes to technical analysis. This may present a risk in terms of dealing with longer timeframes.